Team Global Express, formerly TOLL Logistics Company, is the third largest company in Australia's logistics industry. It operates warehouses in all Australian states and processes roughly 10,000 pickup and delivery orders daily from one warehouse in NSW/Sydney. The company uses a custom-built web-based application for managing all transportation orders.
The 1C:Enterprise platform, in conjunction with the logistics module, developed by 1Ci Partner IronLogic, was introduced to automatically distribute freight to drivers daily. The solution was designed on the 1C:Enterprise BSP configuration with automatic import of orders to the 1C:Enterprise platform via FTP connection.
In this article, we will share some details on the new workflow, highlighting how the integration of the 1C:Enterprise platform has optimized the allocation of resources, scheduling, and streamlined the process of order management and distribution.
Inbound data import and verification
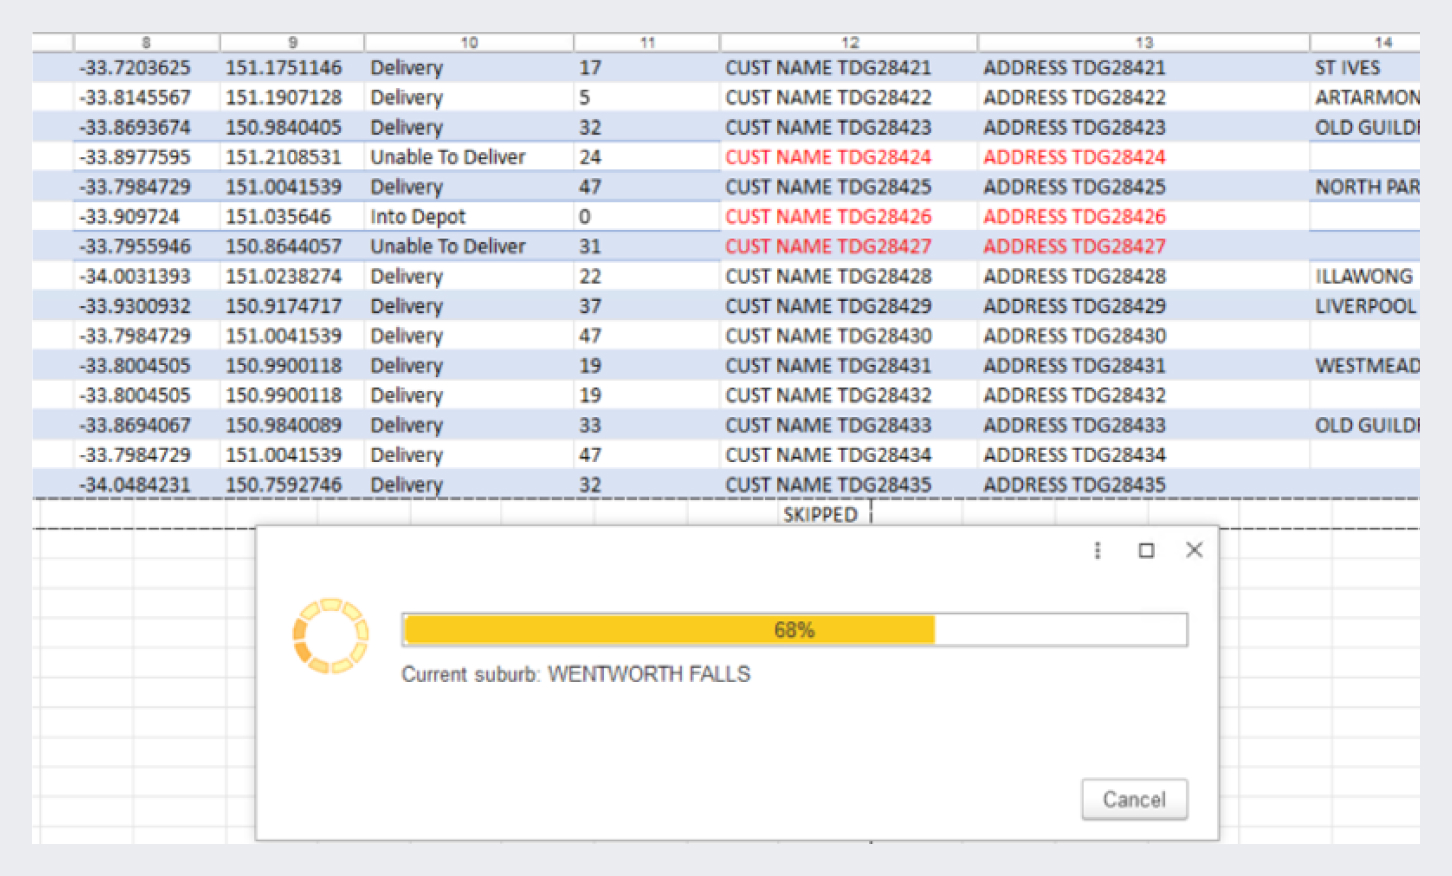
The new workflow begins with an automatic data import into the 1C platform, where data, including GPS coordinates and addresses, is crosschecked against the original information. The 1C platform continuously monitors a designated FTP folder for new files, automatically processing and verifying the data. Discrepancies in GPS coordinates beyond a set threshold are flagged for manual verification, with all coordinates viewable on a map within the platform.

The data import process
After resolving any issues, the corrected data is imported into the 1C:Enterprise. This data includes order timeframes and special requirements, such as refrigeration or handling dangerous goods, ensuring the proper assignment of vehicles and drivers to meet each order's specific needs.
Orders clusterization
To manage the high volume of freight, the system employs AI to allocate orders into different clusters based on factors like past delivery and pickup times, as well as order density in various suburbs. During the import process, two instances are created in 1C:Enterprise:
- a Transportation Order containing all the order information from the Excel file, and
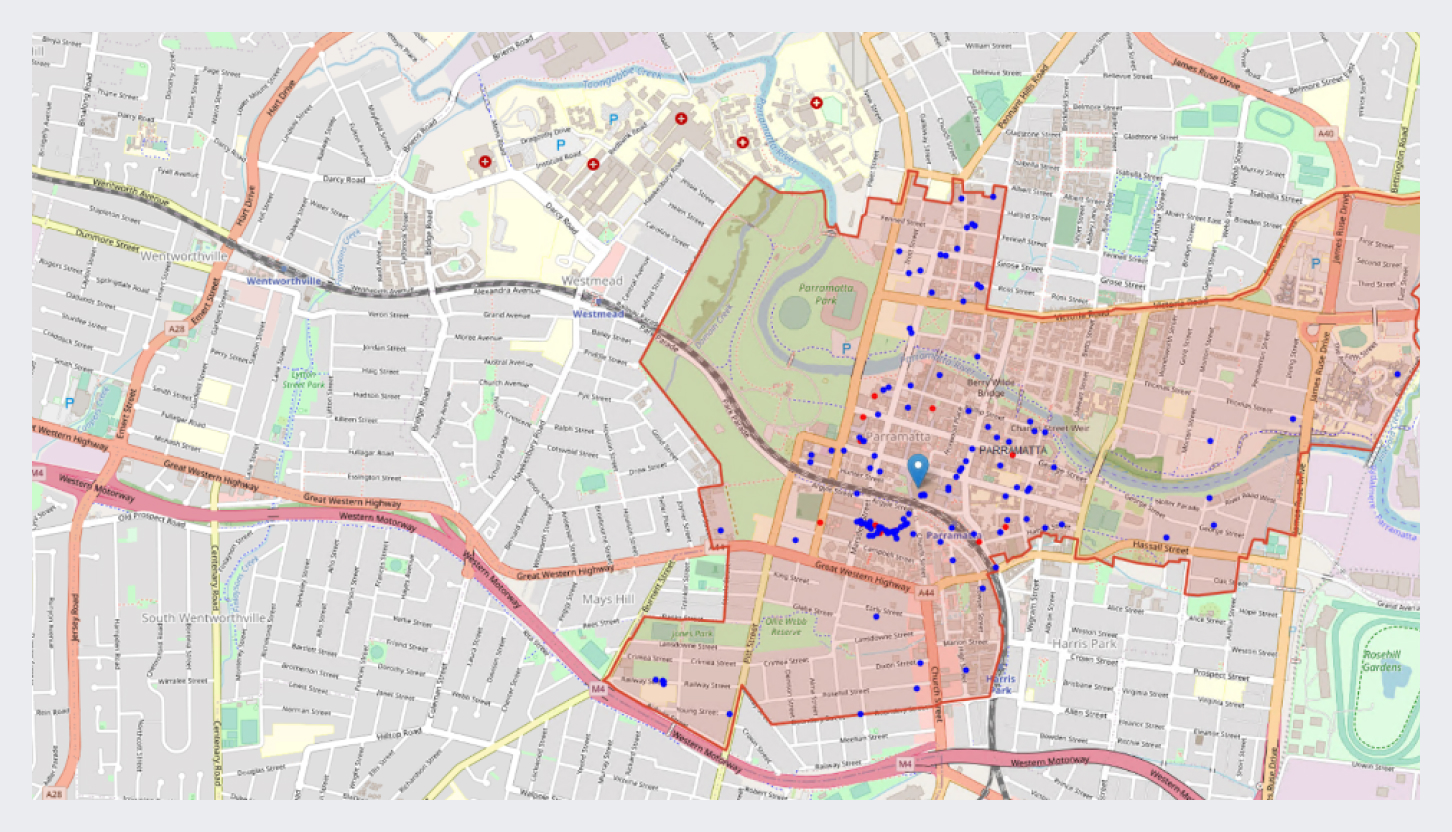
- an Information Register that records key details such as delivery/pickup dates, suburbs, total weight, number of items, and calculated service time needed for each suburb. This register can also visually represent pickups and deliveries on a map, with red points for pickups and blue for deliveries.

This map shows deliveries and pickups within a suburb for the day. Red points indicate pickups, and blue points indicate deliveries.
The cluster calculation process automatically groups zones by considering real driving times between central locations and the number of consignments in each suburb. Instead of focusing on exact delivery and pickup points, the system consolidates consignments within delivery suburbs, streamlining calculations and significantly reducing the number of coordinates required.
This approach improves calculation speed and allows for different visualizations of clusters, including maps, heatmaps, graphs, dendrograms, and tables.
Schedule and route calculation
The system begins by performing a rough calculation of drivers' schedules across various areas, estimating the time drivers will spend in each suburb for deliveries and pickups. Once the approximate delivery/pickup times are determined, the system automatically generates precise routes for drivers.
A 'Transportation Order' document is created containing all relevant information, which can also be viewed on a map. Routes can be calculated by selecting multiple orders in "Transportation orders" or by processing large datasets in two stages: first, grouping orders into a central point with approximate service times, followed by the exact route calculations.
The system allows for the inclusion of various constraints, such as order timeframes, drivers' breaks, vehicle-specific requirements, and vehicle capacity limits. Drivers' working hours and breaks can be easily configured using a Gantt-chart view, where adjustments are made by dragging the time bar or through the driver's menu.

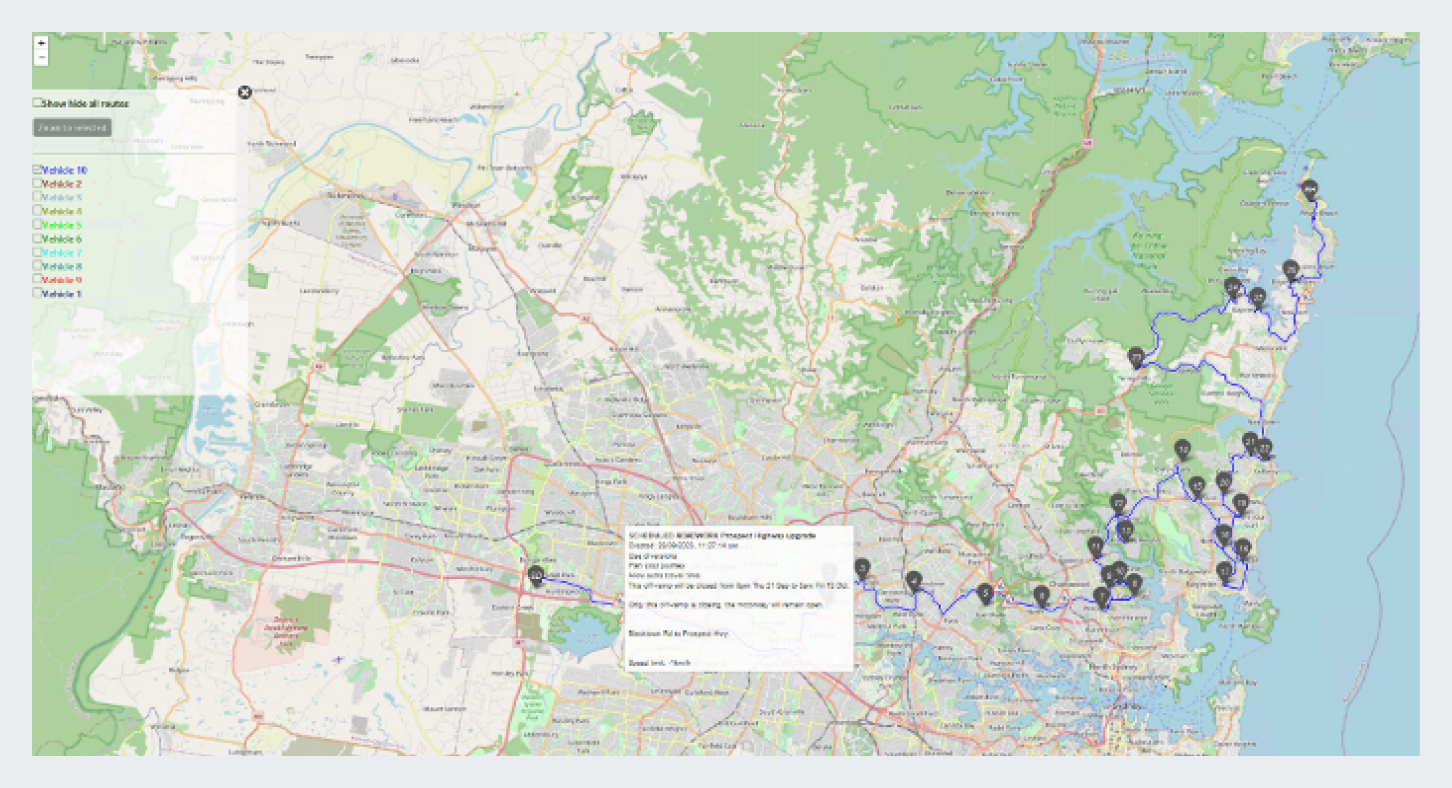
Route details are represented on the map
The final solution includes a summary of each route, with detailed views available in table format, a geographical map, and Gantt chart visualization.
Order distribution
Orders are distributed to drivers' mobile devices (iOS and Android), with automatic feedback from drivers that includes proof of delivery images, signatures, and comments.

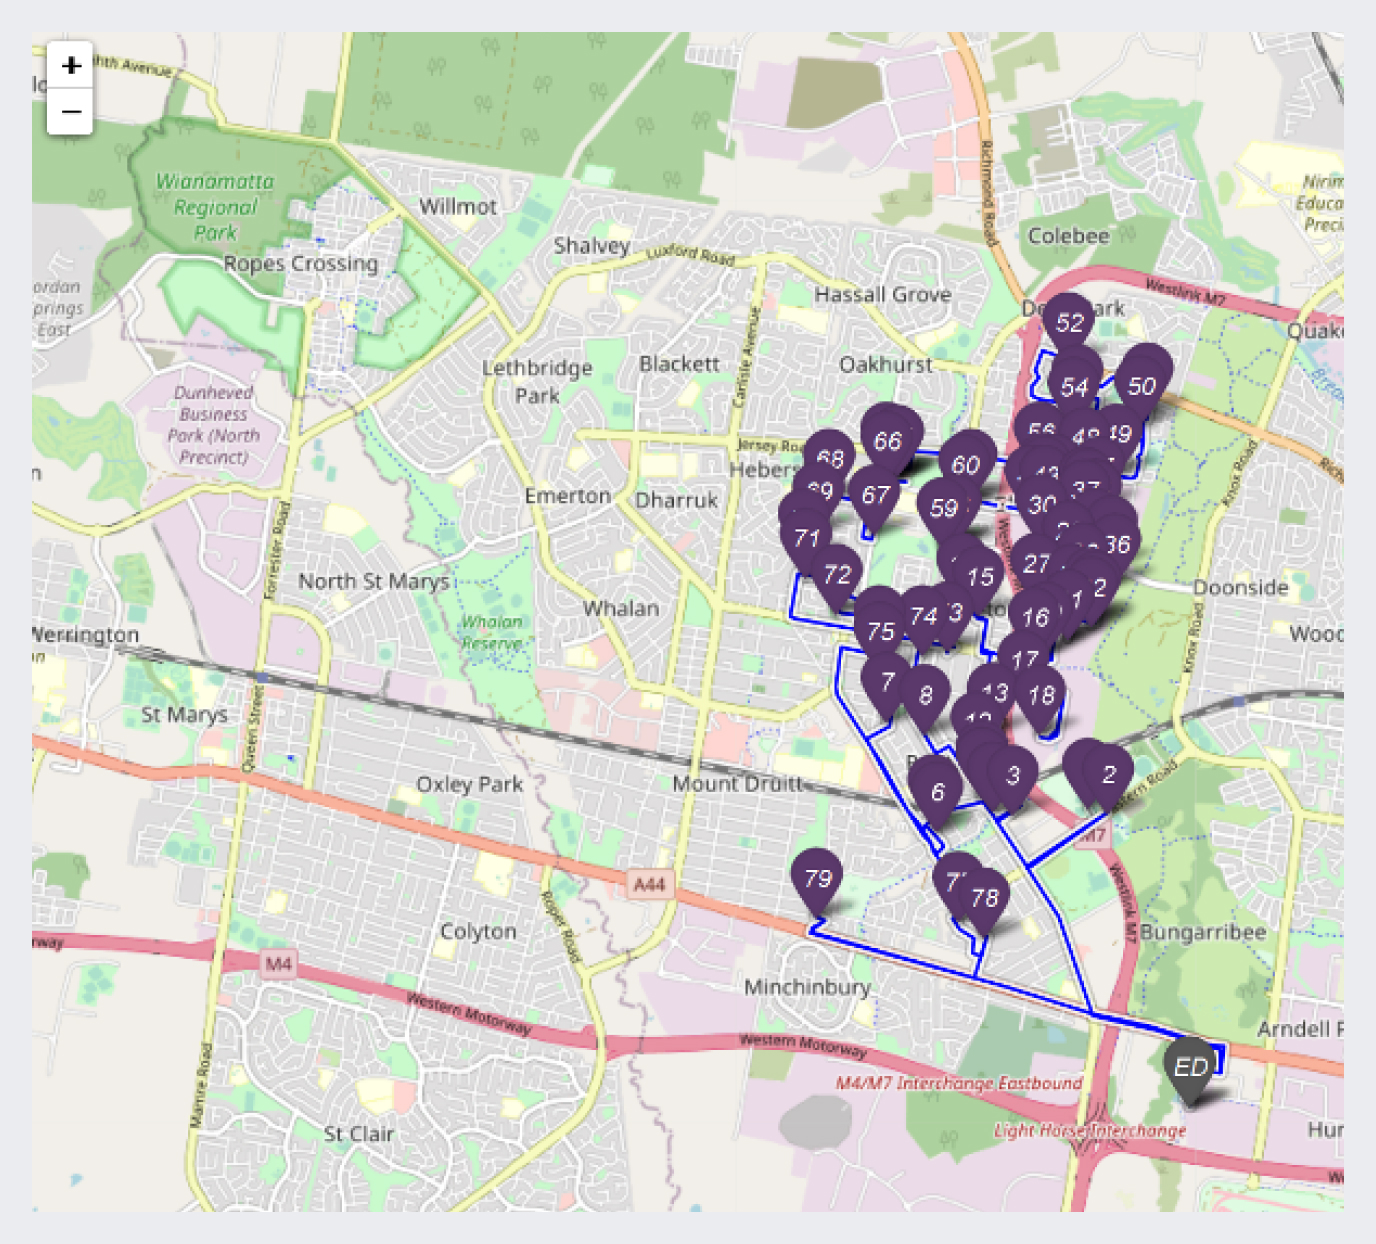
An example of a route within a specific manifest
The system organizes orders into manifests, which are groups of orders and suburbs that drivers need to visit. These manifests can be viewed in a dedicated Manifest form window, with both the list of orders and suburbs available, as well as a visual representation on a map.
In conclusion
To sum up, the integration of 1C:Enterprise into Team Global Express logistics operations has significantly enhanced the efficiency and accuracy of order management and distribution.
Through automated data import, intelligent order clusterization, and precise schedule and route calculation, the system has streamlined the entire logistics process from order receipt to final delivery. The ability to visualize routes, monitor real-time progress, and incorporate driver feedback has further optimized the workflow, ensuring that Team Global Express can meet the complex demands of the logistics industry.


