The article covers forecasting issues in terms of business processes of the enterprise and implementation of these processes in 1C:ERP. It includes seasonal variations in demand, forecasting new products, selecting a forecasting method, preparing data, and identifying outliers. The article provides examples from sewing production of sportswear. These examples do not have a special significance but are chosen merely to illustrate the methods.
When is forecasting needed?
When you release products "for the warehouse", the demand forecast often becomes the starting point for other calculations. This includes sales forecasts, purchase plans, and production plans.
If you produce goods "for the warehouse", you need to forecast the demand in advance (before receiving orders from customers), supply materials for production, manufacture the required goods, and put them in the warehouse. Then customers come and order the products. If the necessary products are in stock, we ship them to the customers. Otherwise, we ship nothing.

Sales order comes before the ordered products are produced

Sales order comes after the products are produced
You can make strategic and tactical decisions based on the forecasting data. For example, in long-term planning, demand forecasting can decide whether to increase production capacity.
Demand forecasting is also necessary at lower planning levels where information is more detailed, but the planning horizon is smaller. For example, when planning the production launch, it is necessary to take into account how many products will be sold from the warehouse during the launch.
Forecasts at different levels will be more or less detailed, but, in any case, forecasts will be forecasts. In other words, a prediction of consumer behavior.
Based on the forecast, the demand for products and materials is calculated. Forecasting in different forms is used at almost all levels of enterprise planning. As a result, the quality of demand forecasting will largely determine the quality of planning and the overall company success.
How to organize the forecasting process?
Demand can be divided into dependent and independent. Independent demand is related to the internal logic of the product, market, and so on. This is consumption in a stable system, when consumers are not affected by promotions, product shortages, and so on. Dependent demand is related to external influences.
"Dependent demand may (and must) be different at different time intervals, but independent demand will be similar both in the past and in the future. This assumption is based on the idea of consumption as a process with an internal logic based on clear concepts of the use value of the product, the size of the market, and the company's share in it."
– SCM. Supply Chain Management
When forecasting sales, it is important to take into account both dependent and independent demand. Mathematical forecasting methods are primarily related to independent demand. To forecast dependent demand, various expert assessments are more often used.

Creating a sales forecast
As a result, the process of creating a sales forecast may be as follows:
-
Analysts, economists, planning and economic department employees draw up a forecast based on sales statistics from previous periods (in other words, forecast independent demand).
-
Sales people/marketing experts/sales managers/designers refine the independent demand forecast in accordance with their vision of the product, customer relations, and the whole situation. That is, they prepare a forecast that takes dependent demand into account.
- The estimates of different experts are gathered together to decide which estimates to take into account, and the sales forecast is approved.
How to set up this process in 1C:ERP?
In 1C:ERP, you can calculate sales forecasts based on data from previous periods and manually adjust them. This allows you to take into account both dependent and independent demand.
When generating a sales forecast, you can use any data stored in the system, for example:
-
Sales of previous periods
-
Sales orders
You can also set filters by product range or by any other parameters.
After calculating the forecast according to the system data, you will have a "draft forecast" to adjust by marketing experts/salespeople.

Setting up sales forecast table filling rules in 1C:ERP
You can manually adjust forecasts according to the system data. When changing the forecast data, you can add a comment so that other planning process participants can understand why the adjustments were made. If the forecast is sent to several marketing experts/salespeople, everyone can make their own adjustment or expert assessment of the sales forecast.

In 1C:ERP, you can enter comments on each row of the forecast table (on each item)
After each one of the experts has made their own assessment and adjusted the sales forecast, the data is collected. Based on this data, a final sales forecast is created or one of the submitted forecasts is approved. You can control the forecast approval process in the system using forecast statuses.

How to account for demand seasonality?
There are many forecasting methods. Most of them are described in detail in the literature. But in practice there are nuances associated, for example, with selecting a method for a specific task or with data preparation. That is why it is often impossible to forecast even an independent demand without knowing specific features of product demand, which form the subject of forecasting.

Seasonal demand chart in Excel
For example, in sportswear sales, you can often see the annual frequency of demand. Every year, consumer behavior fits into a pattern: average sales in the first quarter, low sales in the second quarter, very high sales in the third quarter, and high sales in the fourth quarter. This feature is connected with the specifics of the goods sold and the internal logic of demand. From July to September, the demand increases due to the beginning of a new sports season and a new academic year. In May and June, the demand decreases due to the typical consumer behavior in these months: the end of an academic year and a sports season, the beginning of summer holidays.
Seasonality may not be as pronounced for individual products or categories. For example, the lifespan of dancing shoes is relatively short. If high-quality sweatpants can be worn for several years, gymnastic footwear and foot paws are worn out by professional gymnasts in a couple of months. Customers have to buy them more often, so the demand for them is more stable throughout the year. Or, for example, tights for dancing do not fall in sales as much as most of other products in April and May. During these months, exhibition concerts are held, and dance groups actively buy tights for the whole team.
1C:ERP takes into account that different goods can have completely different demand seasonality. Seasonality of demand is typical not only for sportswear sales, but also for many other industries. Items with similar seasonality patterns are grouped into seasonal groups. For each seasonal group, seasonal indexes are calculated.

In 1C:ERP, you can specify which seasonal group an item belongs to
How to account for different seasonality in different regions?
In the system, you can calculate seasonal indexes by business regions. For example, we know that clothes are sold slightly differently in Moscow compared to other regions of Russia. We know that demand in Moscow is more pronounced in the hot season months. And in general, we sell more in the central region. So, it makes sense to calculate seasonal indexes separately for Moscow and for other regions in order to get two independent sales forecasts.
You can identify that a particular region somehow differs in sales from others not only based on the subjective experience of sellers, but also using reports provided in the "Sales" subsystem of 1C:ERP.
You can calculate seasonal indexes in 1C:ERP automatically based on sales statistics stored in the infobase.

Seasonal index chart in 1C:ERP
How does 1C:ERP calculate seasonal indexes?
There are many approaches to calculating seasonal indexes (additive or multiplicative seasonality). Seasonal indexes in 1C:ERP are calculated as a deviation from the average sales for the period (multiplicative seasonal indexes, the middle line is taken as the base).

Logic of calculating seasonal indexes in 1C:ERP. Excel chart
Apart from seasonal indexes, you can use other methods for seasonal demand. One of the forecasting methods, which takes into account seasonality and trend, is the Holt-Winters method. The method was named after its contributors: Holt proposed a method to account for the trend, and Winters added seasonality.
The exponential smoothing method based on trend and seasonality (Holt-Winters method) usually requires data for 2-3 years:
-
The 1st year to set the initial parameters.
-
The 2nd year to make a forecast. The initial model is "smoothed".
-
The 3rd year to check and select the optimal parameters of the model. For the third year, a sales forecast is built and then compared with the actual data. The model parameters are selected to minimize forecasting errors.
If there is data for only 2 years, the forecast is quite rough. This is because the data of the second year is used both for "smoothing" the model and for selecting parameters to minimize forecasting errors.
One of the important features of selling clothes is frequent changes in the product range (or a part of it). Fashion trends change every season: some products are withdrawn from the production, and new products are introduced. As a result, the maximum amount of statistics data for a specific product may not exceed three years. This imposes restrictions on the methods that can be used in sales forecasting.
In this case, using the Holt-Winters method is not always a good option for forecasting demand for a product or a group of products (although, for example, when forecasting revenue, it gives quite good results even on dirty data). What's more, this method (compared with, for example, seasonal indexes) is much more difficult to implement and explain to the company employees.
"The simpler the model is, the better it is in terms of gaining acceptance of the forecasting process by managers who must make the firm’s decisions. Often a balance must be struck between a sophisticated forecasting approach that offers slightly more accuracy and a simple approach that is easily understood and gains the support of—and is actively used by—the company’s decision makers."
– Business Forecasting, Hanke, Reitsch, Wichern
How to account for demand that depends on goods parameters?
An important feature of sportswear sales is the dependence of demand on the model, color, fabric, and product size. As a rule, the dependence of demand on the size has a normal (Gaussian) distribution, and the distribution parameters will depend on the model and properties of the fabric. For example, pure cotton products are more often bought for young children. For some dark products, demand may be shifted towards larger sizes.

Distribution of product demand depending on the size. Excel table
This dependence is established in practice, by the "close look" method. In general, the issue of selecting these parameters is quite complex and is not always solved this way. We can see the demand dependence on goods parameters not only in the sales of sportswear. In 1C:ERP, you can set up additional accounting dimensions using additional item variants. For example, you can set up the following accounting dimensions: model, color, fabric, and size. Then you can make sales forecasts taking into account the specifics of demand distribution by these parameters.

Item kind settings in 1C:ERP
In the system, data is stored broken down by these variants. So, it is not a problem to create a forecast based on the data of previous periods broken down by the same variants.
For example, a sales report for a period can show sales data broken down by color, fabric, and product size. You can create a sales forecast broken down by the same dimensions and take into account different demand dependence on the color, fabric, and product size.

Sales forecast in 1C:ERP

Part of the sales report in 1C:ERP
How to forecast demand for new products?
Another issue is forecasting demand for new products. That is, building a sales forecast for products that have never been sold yet. This is common not only for sales of clothes, but for many enterprises.
When forecasting new products, you can focus on marketing research, expert assessments, demand for products with "similar" properties, and so on.
For example, if we launch a new product for children made of black cotton, it will be useful to know how black cotton products are sold in general and for children in particular. It will be useful to know how many products for children we sell, and so on.
In 1C:ERP, new items can be forecasted, for example, using distribution standards. We don't know exactly how the new black cotton product for children will be sold, but we can understand:
-
How black goods are sold compared to other colors.
-
How cotton goods are sold compared to other fabric.
This information is kept in distribution standards, which can be calculated from the sales statistics accumulated in the infobase. For example, according to the distribution standard calculated below, black goods are sold slightly better than white ones.
Calculating distribution standards in 1C:ERP
In general, the calculation scheme looks as follows:

Simplified scheme of using standards in 1C:ERP
Demand distribution standards are calculated based on sales of previous periods. Standards are calculated broken down by goods parameters, and then these standards affect the sales forecast for new products.
Distribution standard in 1C:ERP is a rule/share/percentage according to which the total sales figures by category are broken down to specific goods.
Let's analyze the logic of calculating the sales forecast and an example of calculation in 1C:ERP. We are planning sales of the "Women's sportswear" product category. Suppose we sell 10,000 items of this category next year. When creating sales forecasts, we want to take into account the specifics of demand distribution depending on three parameters: size, color, and fabric. Let the distribution of demand for women's sportswear be shifted to sizes above 40. And products made of black synthetics are more often bought.
Fabric distribution standards are as follows: 70% of purchases are viscose clothes and 30% of purchases are cotton clothes.
Color distribution standards are as follows: 40% of purchases are white products and 60% of purchases are black products.
Size distribution standards are shown in the table below:

With three distribution standards, you can decompose the total amount of sales by category, multiplying the standards. For example, we plan to sell 10,000 / 5 * 0.6 * 0.3 * 0.1 = 36 pieces of "Item 1" made of black cotton, size 40.

In 1C:ERP, sales forecasts built using distribution standards are calculated in the same way.
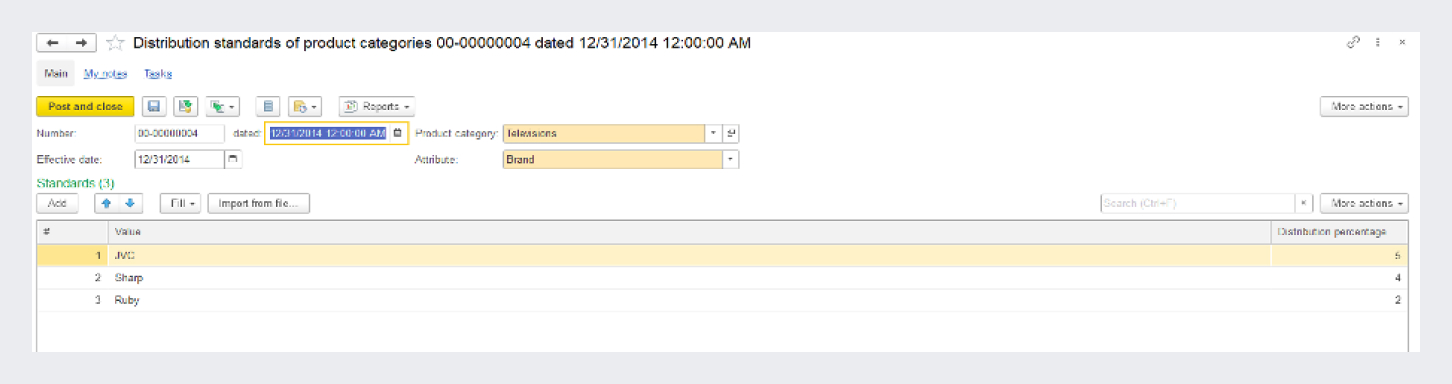
(by brand)
Color distribution standard in 1C:ERP

(by type)
Fabric distribution standard in 1C:ERP
A sales forecast built only using distribution standards cannot completely replace expert forecasting. But such forecast can be the basis for expert adjustments. It is easier and more convenient to adjust the forecast built by the system automatically than to do all the work manually. First, try to make a forecast based on sales data of previous periods, and then adjust this forecast according to your vision of the product, market, and so on.
What data to take?
For high-quality forecasting, it is often not enough to simply choose a successful method and know well the specifics of the goods being sold. The forecast quality largely depends on the quality of data. So, before making a forecast, at the data preparation stage, it is necessary to identify statistical outliers and try to clear the dataset from them.
Outlier — in statistics, a data point that differs significantly from other observations.
Outlier reasons:
-
Measurement errors.
-
Unusual nature of input data. For example, if you randomly measure the temperature of objects in a room, you will get numbers from 18 to 22°C, but the radiator temperature will be 70°.
-
Outliers can also be a part of the distribution. In a normal distribution, every 22nd dimension will differ by twice the standard deviation and every 370th will deviate by three times the standard deviation.
An outlier is something "abnormal" compared to other data. Something that doesn't fit into the standard pattern. However, there is no single criterion of "normality" for determining outliers. Criteria may differ for different tasks, industries, and so on.
Measurement errors
One of the reasons for outliers is measurement errors. That is, the data was initially incorrectly collected, measured, or entered into the system. Using an automated accounting system can minimize this issue.
Suppose Excel is used to collect sales statistics of an enterprise. Salespeople enter data in the table on customers, shipment dates, and purchase amounts. It is required to forecast sales broken down by customer.
When we analyze the data entered by salespeople, interesting things will come out. For example, we will see that Individual Entrepreneur Ivanov and North Start LLC are actually the same client, and it is better to combine them. There will be typos in customer names or in other data. It may happen that for the first year a client was led by one salesperson, and this salesperson recorded the client as "Ivan Ivanov". Then the client was transferred to another salesperson who began to record them as "Wind LLC". It is quite difficult and time-consuming to track such situations, especially if there is a lot of data.
An automated accounting system that eliminates such situations can help in collecting correct data.
If we talk about outliers due to the unusual nature of input data or an outlier as a part of the distribution, there may be different situations.
Goods shortage
The data may be affected by the absence of an item in stock and the subsequent increase in sales for this item. In this case, we first accumulated the deferred demand, and then satisfied it. In the first period, the demand is low. In the second period, it is high. An indicator of an outlier may be the absence/availability of an item in stock.
In 1C:ERP, when generating a sales forecast, you can automatically calculate the share of goods in stock and thus take into account the "deferred demand".

Editing a formula for filling a forecast table in 1C:ERP
Unusual order
An unusual large one-time order can be an outlier. For example, if a product is aimed at children, but someone bought it for adults. The table shows an example of how such order can affect demand forecasting. The first three rows of the table are the demand distribution by size, as it should be in case of the correct product positioning. The bottom three rows are calculated based on actual data containing outliers.

Demand distribution depending on the size, Excel table
If the outlier order is not removed, the demand forecast and further production planning will take this data into account. As a result, the finished product warehouse will receive surpluses of large "non-standard" sizes. What is why it is important to identify outliers. Random deviations should not affect the quality of forecasting.
In 1C:ERP, you can filter out unnecessary data when calculating seasonal indexes and distribution standards. You can also set filters when creating a sales forecast: the forecast will be generated based on the necessary data only. For example, you can consider only category A products (in the ABC analysis).

Filter settings in forecast population data sources
Industry and company specifics
One of the industry-specific features of sportswear production is to meet the demand of sports teams and dance groups. In this case, as a rule, the customer wants to purchase uniforms for the entire team by a certain date. For example, by the beginning of the training season or for specific competitions. In sales, sports teams are a separate target group whose demand can be forecasted with high accuracy. Demand is cyclical and varies by month. As a rule, the closer the competition date, the higher the demand. Competitions in different regions take place at different times, so the dynamics of sales by region may differ.
The demand of sports teams has some specifics:
-
Usually, teams purchase the same items.
-
The sizes are the same or similar.
-
Purchases for a team are often made before a specific sporting event: the start of the sports season, competitions, and so on.
The demand of teams may look like a random outlier. So, when detecting outliers, it is necessary to understand the outlier logic. Perhaps this is not an outlier, but a dependent demand. Having identified a pattern, you can adjust the final forecast based on it.

Excel chart. Demand of sports teams by month for region No. 1

Excel chart. Demand of sports teams by month for region No. 1
With sales statistics for previous years, knowing the regions of customers and their kinds of sports, you can adjust the sales forecast for the "sports teams" target group.

Excel chart. Total demand of sports teams by regions No. 1 and No. 2
The demand of the "sports teams" target group depends on dates of competitions, while the rest of the demand is not tied to dates of competitions in any way. That is why you need to analyze the "sports teams" target group separately from the rest of the orders. With separate analysis of sports teams, you can significantly adjust the overall sales forecast.

Excel chart. Total demand without considering "sports teams"

Excel chart. Total demand considering "sports teams"
Conclusion
Demand forecasting is an important part of enterprise planning and management. Along with mathematical methods of statistics, an important role in forecasting is given to expert assessment and understanding of the logic of product demand.